Business impact analysis for business continuity: Recovery time requirements
Use business impact analysis (BIA) to define recovery time requirement terms and looks at how those elements interact.

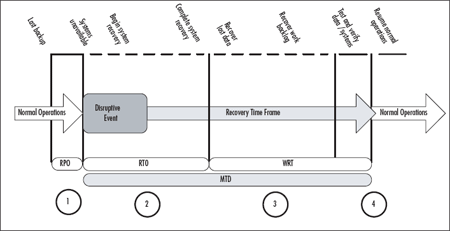
Related to impact criticality are recovery time requirements. Let's define a few terms here that will make it easier throughout the rest of the analysis to talk in terms of recovery times. As you read through these definitions, you can refer to Figure 4.3 for a representation of the relationship of these elements.
Maximum Tolerable Downtime (MTD)
This is just as it sounds -- the maximum time a business can tolerate the absence or unavailability of a particular business function. (Note: The BCI in the UK uses the phrase Maximum Tolerable Outage (MTO) instead.) Different business functions will have different MTDs. If a business function is categorized as mission-critical, or Category 1, it will likely have the shortest MTD. There is a correlation between the criticality of a business function and its maximum downtime. The higher the criticality, the shorter the maximum tolerable downtime is likely to be. Downtime consists of two elements, the systems recovery time and the work recovery time. Therefore, MTD = RTO + WRT.
Recovery Time Objective (RTO)
The time available to recover disrupted systems and resources. It is typically one segment of the MTD. For example, if a critical business process has a three-day MTD, the RTO might be one day (Day 1). This is the time you will have to get systems back up and running. The remaining two days will be used for work recovery (see Work Recovery Time).
Work Recovery Time (WRT)
The second segment that comprises the maximum tolerable downtime (MTD). If your MTD is three days, Day 1 might be your RTO and Days 2 to 3 might be your WRT. It takes time to get critical business functions back up and running once the systems (hardware, software, and configuration) are restored. This is an area that some planners overlook, especially from IT. If the systems are back up and running, they're all set from an IT perspective. From a business function perspective, there are additional steps that must be undertaken before it's back to business. These are critical steps and that time must be built into the MTD. Otherwise, you'll miss your MTD requirements and potentially put your entire business at risk.
Recovery Point Objective (RPO)
The amount or extent of data loss that can be tolerated by your critical business systems. For example, some companies perform real-time data backup, some perform hourly or daily backups, some perform weekly backups. If you perform weekly backups, someone made a decision that your company could tolerate the loss of a week's worth of data. If backups are performed on Saturday evenings and a system fails on Saturday afternoon, you've lost the entire week's worth of data. This is the recovery point objective. In this case, the RPO is one week. If this is not acceptable, your current backup processes must be reviewed and revised. The RPO is based both on current operating procedures and your estimates of what might happen in the event of a business disruption. For example, if a tornado touches down in your town and your data center is without power, you may implement your BC/DR plan. If you have an alternate computing location, you may transfer operations to that location. Your next step would be to determine the status of the data. Are you attempting to update systems using backups or were these alternate locations kept up to date? When was the last data backup performed relative to business operations? What do you need to bring systems up to date? These are the questions you'd need to answer after a business disruption. Therefore, it's important to define your RPO beforehand and ensure your recovery processes address these timelines.
Let's look at how these elements interact. Figure 4.3 graphically depicts the interplay between MTD, RTO, WRT, and RPO. If your company has mission-critical and vital business processes that do not interact with computer systems of any kind, you still need to perform a business impact analysis in order to understand how these manual systems may be impacted by a business disruption, especially natural disasters. At the end of this chapter, we'll walk through an example to help illustrate these concepts. Most companies use technology and computer systems to some extent and the graphic in Figure 4.3 shows how the recovery time is impacted by a business disruption.
Figure 4.3 Critical Recovery Timeframes

- Point 1: Recovery Point Objective -- The maximum sustainable data loss based on backup schedules and data needs
- Point 2: Recovery Time Objective -- The duration of time required to bring critical systems back online
- Point 3: Work Recovery Time -- The duration of time needed to recover lost data (based on RPO) and to enter data resulting from work backlogs (manual data generated during system outage that must be entered)
- Points 2 and 3: Maximum Tolerable Downtime -- The duration of the RTO plus the WRT.
- Point 4: Test, verify, and resume normal operations
During normal operations, there is usually some gap between the last backup performed and the current state of the data. In some operations, this may be minutes or hours; in most organizations it is hours or days. This timeframe is the recovery point objective. In most organizations, this is the same as the period of time between backups. We see at circle 1 that there is a gap showing the point of the last backup and the state of current data, just before the disruption occurs. That's the point at which one or more critical systems becomes unavailable and business continuity and disaster recovery planning activities are initiated. The first phase of the Maximum Tolerable Downtime (MTD) is the recovery time objective. This is the timeframe during which systems are assessed, repaired, replaced, and reconfigured. The RTO ends when systems are back online and data is recovered to the last good backup. The second phase of the MTD then begins.
This is the phase when data is recovered through automated and manual data collection processes. There are two elements of work recovery time. The first is the manual collection and entry of data lost, typically because systems went down between backups. The second phase addresses the backlog of work that may have built up while systems were down. Most companies try to recover the data up to the disruptive event to bring the systems current and then address the backlog, but your business processes may dictate a different recovery order. The key is to understand that there is a delay between the time the systems are back online and the time when normal operations can resume. During the periods indicated by circles 2 and 3, emergency workarounds and manual processes are being used. These are processes that will be developed later in your BC/DR planning process. For example, if a CRM system is down, what processes will your sales, marketing, and customer sales service teams use to interface with and manage customer service delivery? You'll define that in the planning process. Circle 4 indicates the transition from business continuity and disaster recovery back to normal operations. There may be some overlap as manual processes are turned back over to automated processes and you may choose to do it in a rolling fashion -- perhaps by department or geographic region.
As you collect your impact data, you'll also need to begin determining the recovery time objectives. You may choose to create a rating system so you can quickly determine recovery time objectives. For example, you might determine that mission-critical business systems or functions should have recovery windows as follows:
- Category 1: Mission-Critical -- 0--12 hours
- Category 2: Vital -- 13--24 hours
- Category 3: Important -- 1--3 days
- Category 4: Minor -- more than 3 days
You and your team, with input from the subject matter experts, can determine the appropriate maximum tolerable downtime (MTD) requirements. For some companies, a mission-critical business function could have an MTD of a week. For others, it might be 0 to 2 hours. There is an inverse correlation between the amount of time you can tolerate an outage and the cost of setting up systems that allow you to recover in that time frame. If you can't afford much downtime, you'll clearly have to invest more in preventing downtime and in having systems in place that allow fast recovery times. If you're a small company and can afford a longer MTD, you can spend less on preventing or recovering from outages.
Let's look at an example. In a small company, you may very well be able to do without even mission-critical systems for a couple of days or a week if you really had to. It's possible that you contract with an outside IT service provider to maintain, troubleshoot, and repair your computer systems. If you want a guaranteed two-hour response time, your monthly maintenance costs will be significantly higher than if you sign up for a guaranteed next business day response. So, if you really can't afford to be without that mission-critical business function for more than about eight hours (two-hour response time, six-hour repair time), you'll have to pay more to your service company and you'll probably also have to purchase additional computer equipment to provide some redundancy to prevent extended downtime. These costs add up and the less disruption your business can afford, the more it will cost you to prevent or mitigate those risks. We'll discuss this in more detail in Chapter 5, but it's within the business impact analysis segment where you have to begin making these kinds of assessments.
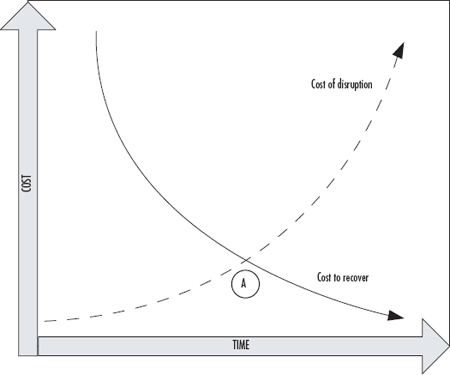
It's important to note during your impact analysis and subsequent mitigation planning phases that there is an optimal recovery point. Figure 4.4 shows the inverse relationship between the cost of disruption and the cost of recovery. Earlier in this book, we discussed the fact that any business continuity and disaster recovery plan had to be tailored to the unique needs and constraints of the organization. This is particularly true when it comes to the financial costs involved with disruption and recovery.
Figure 4.4 Optimal Balance between Cost of Disruption and Cost of Recovery

You can see that the longer you allow a disruption to go on, the more expensive it becomes to the business. Conversely, the longer you have to recover, the less expensive recovery itself becomes. This makes sense when you understand that the longer a business disruption goes on, the more lost revenues, lost sales, and lost customers you accumulate. At the same time, if you need to recover your systems immediately, it's going to cost more to implement things such as zero downtime solutions and hot sites. If you can afford to take a bit more time to recover you have more options, and these options are typically less expensive. If you start plotting these points, you will find an optimal point between these two costs, shown in Figure 4.4 by point A. Each company's intersecting points (point A) will be different based on your company's financial constraints and operating requirements.
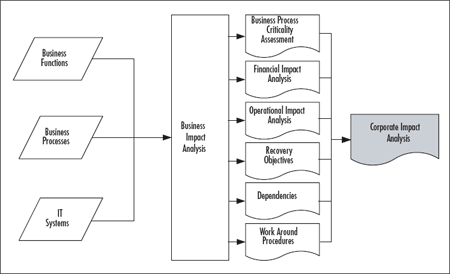
Next, let's look at what the entire analysis process looks like, as shown in Figure 4.5. After we explore this, we'll take a look at the specific data required for inputs and outputs to this process.
Figure 4.5 BIA Inputs and Outputs

In this segment of BC/DR planning, we're looking at business functions, processes, and IT systems to determine criticality. Business functions can be defined as activities such as sales, marketing, or manufacturing. Business processes can be defined as how those activities occur. Are your sales conducted via a Web site, via telephone, via sales calls? How are orders processed? How are employees hired? These are business processes, they describe how the functions get done. By first identifying business functions, you can focus on the key processes in each function to develop a comprehensive view of your company. The third input area, shown in Figure 4.5, is IT systems. In most companies, the business processes are carried out in part through computer systems, applications, and other automated systems. Identifying mission-critical business functions and processes and how they intersect with IT systems will help you map out your business continuity and disaster recovery strategies.
Once you have compiled that data, you'll perform the analysis to generate the needed outputs, including the criticality assessment, the impact assessments (financial and operational), required recovery objectives, dependencies, and work-around procedures. The work-around procedures will enable you to get critical business functions back up and running as quickly as possible. These work-around procedures may be used during the RTO and WRT periods discussed earlier and shown in Figure 4.3. As you can see, the output is a comprehensive corporate impact analysis. This is the same output shown in Figure 4.2 and is the end of the larger risk assessment phase in our overall BC/DR planning process. The impact analysis will be used as input to the risk mitigation planning segment of the BC/DR project and we'll discuss that in Chapter 5.
Use the following table of contents to navigate to chapter excerpts.
| ABOUT THE BOOK: |
| Business Continuity Planning (BCP) and Disaster Recovery Planning (DRP) are emerging as the next big thing in corporate IT circles. With distributed networks, increasing demands for confidentiality, integrity and availability of data, and the widespread risks to the security of personal, confidential and sensitive data, no organization can afford to ignore the need for disaster planning. Business Continuity & Disaster Recovery for IT Professionals offers complete coverage of the three categories of disaster: natural hazards, human-caused hazards and accidental/technical hazards, as well as extensive disaster planning and readiness checklists for IT infrastructure, enterprise applications, servers and desktops – among other tools. Purchase the book from Syngress Publishing |
| ABOUT THE AUTHOR: |
| Susan Snedaker, Principal Consultant and founder of Virtual Team Consulting, LLC has over 20 years experience working in IT in both technical and executive positions including with Microsoft, Honeywell, and Logical Solutions. Her experience in executive roles at both Keane, Inc. and Apta Software, Inc. provided extensive strategic and operational experience in managing hardware, software and other IT projects involving both small and large teams. As a consultant, she and her team work with companies of all sizes to improve operations, which often entails auditing IT functions and building stronger project management skills, both in the IT department and company-wide. She has developed customized project management training for a number of clients and has taught project management in a variety of settings. Ms. Snedaker holds a Masters degree in Business Administration (MBA) and a Bachelors degree in Management. She is a Microsoft Certified Systems Engineer (MCSE), a Microsoft Certified Trainer (MCT), and has a certificate in Advanced Project Management from Stanford University. |


