IT Channel.com
Windows task manager: Viewing Windows 7 processes and applications
By null
Solutions provider takeaway: You can use the task manager to view Windows 7 applications and processes, and you can also end and restart them if they're unresponsive. The task manager has six tabs in all, including the performance tab that displays usage graphs.
|
||||
Task Manager
Task Manager, for many of us, is our "go-to" tool for solving problems. You have a problem, you go to Task Manager—it's almost ingrained in us. You'll see immediate information about your processes, CPU usage, memory, network, and so forth.
For one thing, the first time you start Task Manager, you'll notice that you can now choose to see processes from all the users of the system. One thing you'll notice right away is the Description aspect to the Processes tab and the Services tab (see Figure 11.8). This was added in Vista.
One of the new features of Task Manager is the ability to create a mini-dump file of an application that is running. You can right-click an application or process that is running and choose Create Dump File, which displays a dialog box that shows you where that file has been written. You can use this feature to discover why a particular application might be crashing so often. Or if a process has already crashed and is no longer responding, you can try to discover the cause.
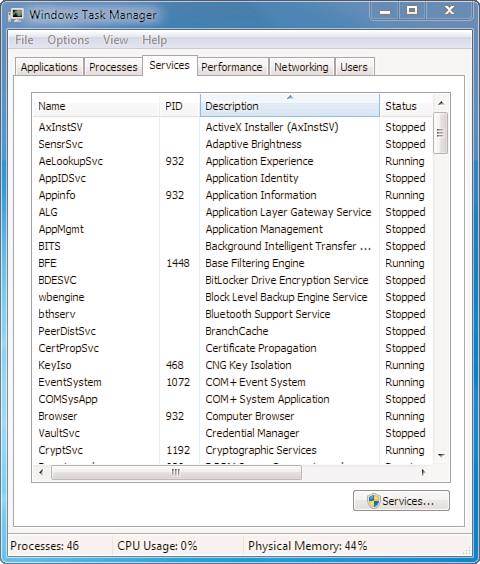
Figure 11.8 Task Manager showing the descriptions and options for Services.
Task Manager has six tabs:
- Applications
- Processes
- Services
- Performance
- Networking
- Users
In addition to the tabs, there is a menu at the top that serves up even more options that we'll also cover in the following section. Let's start by looking at the Applications tab.
Applications
This is the starting point for Windows Task Manager and there is more here than meets the eye. The Task column displays a list of open applications. This is a live look at your system. If you close one of the applications, it removes itself from this list.
The Status column shows whether the application is Running or Not Responding. This simple layout allows you to quickly see what application is acting up. At the bottom are three buttons:
- End Task: Closes an application or process.
- Switch To: Switches between applications or processes.
- New Task: Starts an application from the dialog box that opens when you click this button.
Below these buttons are real-time information regarding Processes, CPU Usage, and the amount of used Physical Memory. At a glance, you can see what resource is affected by this view in the Task Manager.
Using Task Manager to End an Application
The following steps show you how to use Task Manager to end an application.
- Press Ctrl+Alt+Del.
- Click Start Task Manager.
- In the Task area, locate an application that is running and click it.
- Click the End Task button.
With this simple process, you see how easy it is to close an application. Of course, the purpose of Task Manager is to help you troubleshoot and cope with crashed applications, not ones that are working fine. So the next time an application hangs too long, follow the above steps again. When an application hangs too long, the Status column shows Not Responding. Clicking End Task should close the application.
On rare occasion, an application might stubbornly stay open despite your attempts to end it. In this situation, press Ctrl+Alt+Del again and repeat the steps to close it.
Using Task Manager to Start an Application
The following steps show you how to use Task Manager to start an application. In this example, you learn to end explorer.exe and restart it through Task Manager.
- Press Ctrl+Alt+Del.
- Click Start Task Manager.
- Click the Processes tab.
- In the Image Name column, locate explorer.exe.
- Click the End Process button. Windows Explorer closes but all other applications, including Task Manager, remain open.
- Click the Applications tab.
- Click the New Task button. The Create New Task dialog box opens.
- In the Open text box, type explorer.
- Click OK. Windows Explorer opens.
The Create New Task button comes in handy in situations that call for you to reopen an application. If you know the path to the application, you can enter it; otherwise, you can click the Browse button to navigate to the application name.
One other option to mention on the Applications tab appears when you right-click any application. You will find Create Dump File. Dump files capture data from the application that you can share with software developers and programmers who are trying to determine why an application crashes or has other faults. The dump file is saved locally and is a copy of what the application looks like in memory. You can send it to your help and support department, which can analyze its contents.
Processes
This tab gives you a bird's-eye view of all your processes, including a button to Show Processes from all Users and the aforementioned End Process button. The Process tab is invaluable if your computer is running slow for an undetermined reason. By viewing the Image Name, CPU, Memory, and Description columns, you can focus on the precise area causing trouble.
Using Task Manager to Monitor an Application's CPU and Memory Usage
The following steps show you how to monitor an application's CPU and memory usage. In this example, you monitor Windows Media Player.
- Press Ctrl+Alt+Del.
- Click Start Task Manager.
- Click the Processes tab.
- While still keeping the Task Manager in view on-screen, open Windows Media Player. As the application opens, watch the CPU and Memory columns for the information it displays for Windows Media Player. (You may need to resize the column to see the heading names.)
- Close Windows Media Player.
- Open other applications and monitor their resource usage through the processes tab.
By viewing your process resource usage, it becomes evident very quickly which process is causing the problem. If you are looking for a specific process and you have several open, click Image Name to sort the column.
If a process is causing problem, it can be stopped by using the Processes tab—as you learn in the following section.
Using Task Manager to End a Process
This short exercise teaches you how to end a process through Task Manager. Use caution when doing this on applications not discussed in this exercise. Not ending a process safely can result in data loss or in rare cases, system instability.
- Press Ctrl+Alt+Del.
- Click Start Task Manager.
- Click the Processes tab.
- Look at the Description column and select a process that you know (for example, select Windows Task Manager).
- Click the End Process button. You are asked to confirm this.
- Click End Process again. The process ends.
|
||||
A quick way to find a process associated with an application is to first locate the app on the Applications tab, right-click it, and then choose Go To Process. This takes you to the Processes tab with the associated process highlighted.
If more than one user is logged-on to your machine when you run Task Manager and you are unable to see the process you are looking for, the Processes tab includes a Show Processes From All Users button that you can click to see any processes in use by other users logged on.
You can also right-click an application and choose Properties to access the properties of that particular executable. For example, you can change compatibility options, permissions, as well as other aspects of the program.
Services
This tab shows you your services, some descriptive information regarding them (Description and Group information), and if they are running or not. You can use this tab to stop or start services.
Using Task Manager to Stop and Restart a Service
The following steps show you how to stop and restart a service through Task Manager.
- Press Ctrl+Alt+Del.
- Click Start Task Manager.
- Click the Services tab.
- In the Description column, scroll down to Print Spooler, right-click it, and choose Stop Service.
- Depending on your security configuration, you might receive an access-denied message. If this is the case, click Print Spooler again.
- Click the Services button in the lower right.
- If a UAC window opens, click Yes.
- In the main pane, scroll down to Print Spooler, right-click it, and choose Stop.
- To restart the service, follow these same steps, but when you right-click Print Spooler, and choose Start instead.
Performance
This tab includes a feature that is new to Windows 7 (although you might not notice it). Under Physical Memory (MB) group, Vista features Total, Cached, and Free. Windows 7 has added Available to that group.
- Total: The amount of RAM installed on the system in MB.
- Cached: The amount of physical RAM used for system resources.
- Available: The total of standby and free memory for programs.
- Free: The amount of memory that is currently unused or doesn't contain useful information.
The Performance tab also includes the Resource Monitor button. This is a logical location since you might be coming to the Performance tab to troubleshoot a problem. You can usually find what you are looking for in the CPU and Memory Usage graphs (see Figure 11.9). If you can't find it there, click the Resource Monitor button to access a plethora of monitoring tools.
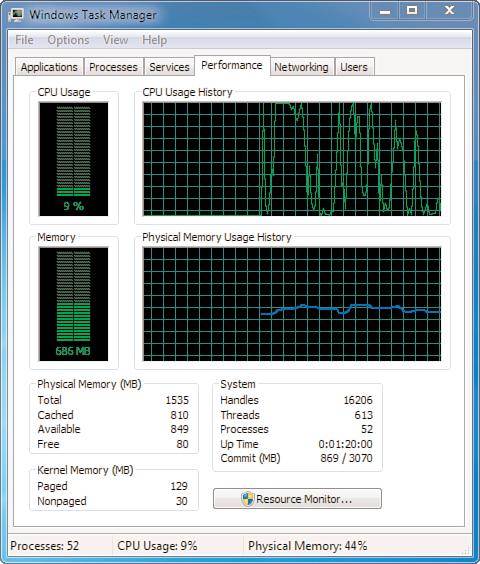
Figure 11.9 Get real-time stats in the Performance tab.
Networking
The Networking tab shows a graph of your active network connection, where you can view the network utilization of your connections. The bottom of this tab also includes columns showing the Link Speed and the connection State.
Users
This tab shows you the users who are logged on now. By right-clicking a user, you can Disconnect a user who is remotely connected to your computer or Log Off a local user.
Using Task Manager to Log-Off a Local User
The following steps show you how to log-off a local user through Task Manager. To complete this exercise, you will need multiple users logged-on at once.
- Press Ctrl+Alt+Del.
- Click Start Task Manager.
- Click the Users tab.
- Right-click the User you would like to log off and choose Log Off.
- A warning message appears, asking you to confirm that you want to log off this user (because the user's unsaved data might be lost). Click Log Off User and the user is logged off.
Menu Items
There are a few notable selections available on the Task Manager menu:
- On the File menu, you can select New Task to open a program (just as you can by using the Applications tab).
- On the View menu, you can adjust the refresh speed of the monitoring of your incoming resources. To see faster refreshes on your incoming data for CPU and Memory, go to View, click Update Speed, and then choose High.
![]()
![]() Managing and Monitoring Windows
7
Managing and Monitoring Windows
7
![]() Using
the reliability and resource monitor in Windows 7
Using
the reliability and resource monitor in Windows 7
![]() Using
Windows 7 performance monitor to view data
Using
Windows 7 performance monitor to view data
![]() Windows
task manager: Viewing Windows 7 processes and applications
Windows
task manager: Viewing Windows 7 processes and applications
![]() Using
system properties to configure Windows 7 options
Using
system properties to configure Windows 7 options
Printed with permission from Que Publishing. Copyright 2010. Using Microsoft Windows 7 by J. Peter Bruzzese. For more information about this title and other similar books, please visit http://www.quepublishing.com.
11 Aug 2010