Parallel processing: Using parallel SQL effectively
Using parallel processing only makes sense for your customers in specific situations. Find out when to use parallel SQL with the Oracle databse to avoid excessive usage.
Solution provider's takeaway: To avoid over usage, you need to know the right situations to use parallel processing. Get a grasp on when to use parallel SQL with the Oracle database and how to monitor parallel SQL.
Deciding when to use Parallel processing
A developer once saw me use the parallel hint to get a rapid response to an ad-hoc query. Shortly thereafter, every SQL that developer wrote included the parallel hint, and system performance suffered as the database server became overloaded by excessive parallel processing.
The lesson is obvious: If every concurrent SQL in the system tries to use all the resources of the system, parallel makes performance worse, not better. Consequently, we should use parallel only when doing so improves performance without degrading the performance of other concurrent database requests.
The following sections discuss some of the circumstances in which you can effectively use parallel SQL.
Your server computer has multiple CPUs
Parallel processing will usually be most effective if the computer that hosts your Oracle database has multiple CPUs. This is because most operations performed by the Oracle server (accessing the Oracle shared memory, performing sorts, disk accesses) require CPU. If the host computer has only one CPU, the parallel processes might contend for this CPU, and performance might actually decrease.
Almost every modern computer has more than one CPU; dual-core (2 CPUs in a single processor slot) configurations are the minimum found in systems likely to be running an Oracle server including the desktops and laptops running development databases. However, databases running within Virtual machines might be configured with only a single (virtual) CPU.
The data to be accessed is on multiple disk drives
Many SQL statements can be resolved with few or no disk accesses when the necessary data can be found in the Oracle buffer cache. However, full table scans of larger tables—a typical operation to be parallelized—tends to require significant physical disk reads. If the data to be accessed resides on a single disk, the parallel processes line up for this disk, and the advantages of parallel processing might not be realized.
Parallelism will be maximized if the data is spread evenly across the multiple disk devices using some form of striping; we discuss principles of striping in Chapter 21.
The SQL to be parallelized is long running or resource-intensive
Parallel SQL suits long running or resource-intensive statements. There is an overhead in activating and coordinating multiple parallel query processes and in co-coordinating the flow of information between these processes. For short-lived SQL statements, this overhead might be greater than the total SQL response time.
Parallel processing is typically used for
- Long-running reports
- Bulk updates of large tables
- Building or rebuilding indexes on large tables
- Creating temporary tables for analytical processing
- Rebuilding a table to improve performance or to purge unwanted rows
Parallel processing is not usually suitable for transaction processing environments. In these environments, multiple sessions process transactions concurrently. Full use of available CPUs is already achieved because each concurrent transaction can use a different CPU. Implementing parallel processing might actually degrade overall performance by allowing a single user to monopolize multiple CPUs.
Parallel processing is suitable for long-running operations in low-concurrency environments. Parallel processing is less suitable for OLTP style databases.
The SQL performs at least one full table, index or partition scan
Parallel processing is generally restricted to operations that include a scan of a table, index, or partition. However, the SQL might include a mix of operations, only some of which involve scans. For instance, a nested loops join that uses an index to join two tables can be fully parallelized providing that the driving table is accessed by a table scan.
Although queries that are driven from an index lookup are not normally parallelizable, if a query against a partitioned table is based on a local partitioned index, each index scan can be performed in parallel against the table partition corresponding to the index partition. We see an example of this later in the chapter.
There is spare capacity on your host
You are unlikely to realize the full gains of parallel processing if your server is at full capacity. Parallel processing works well for a single job on an underutilized, multi-CPU machine. If all CPUs on the machine are busy, your parallel processes will bottleneck on the CPU and performance will be degraded.
Remember that when a session uses parallel query, it requests a greater share of machine resources. If many processes simultaneously attempt to run in parallel, the result will usually be that some fail to run at the requested degree of parallelism whereas others acquire more than their fair share of resources.
The SQL is well tuned
Parallelizing a poorly tuned SQL might well reduce its execution time. However, you'll also be magnifying the impact of that SQL on the database server and increasing its impact on other sessions. You should make sure that the SQL is efficient before attempting to grant it access to more of the database server's resources. Parallelizing the SQL is not an alternative to tuning the SQL.
Configuring parallel processing
Oracle tries to automate the configuration of the system to maximize the performance of parallel operations. However, there's still a lot of scope for manually tweaking the database and SQL for optimal parallel performance.
Determining the degree of parallelism
An optimal DOP is critical for good parallel performance. Oracle determines the DOP as follows:
- If parallel execution is indicated or requested, but no DOP is specified, the default DOP is set to twice the number of CPU cores on the system. For a RAC system, the DOP will be twice the number of cores in the entire cluster. This default is controlled by the configuration parameter PARALLEL_ THREADS_PER_CPU.
- From Oracle 11g release 2 forward, If PARALLEL_DEGREE_POLICY is set to AUTO, Oracle will adjust the DOP depending on the nature of the operations to be performed and the sizes of the objects involved.
- If PARALLEL_ADAPTIVE_MULTI_USER is set to TRUE, Oracle will adjust the DOP based on the overall load on the system. When the system is more heavily loaded, the DOP will be reduced.
- If PARALLEL_IO_CAP is set to TRUE in Oracle 11g or higher, Oracle will limit the DOP to that which the IO subsystem can support. These IO subsystem limits can be calculated by using the procedure DBMS_RESOURCE_ MANAGER.CALIBRATE_IO.
- A DOP can be specified at the table or index level by using the PARALLEL clause of CREATE TABLE, CREATE INDEX, ALTER TABLE, or ALTER INDEX.
- The PARALLEL hint can be used to specify the DOP for a specific table within a query.
- Regardless of any other setting, the DOP cannot exceed that which can be supported by PARALLEL_MAX_SERVERS. For most SQL statements, the number of servers required will be twice the requested DOP.
As we saw in Figure 13-4, increasing the DOP beyond an optimal point fails to result in further performance increases. However, increasing the DOP beyond optimal can have a significant negative effect on overall system performance. Although the SQL being parallelized might not degrade significantly as the DOP increases, load on the system continues to increase and can cause other SQLs running concurrently to suffer reduced response time.
Figure 13-5 shows how increasing the DOP influences CPU utilization. As we hit the optimal DOP—approximately 8 for this system—the reduction in query-elapsed time flattens out. However, the time other sessions spend waiting for CPU to become available continues to increase. Other sessions wanting to access the CPU will need to wait, resulting in degraded response time.
Increasing the DOP beyond the optimal level might overload the host, degrading the performance of other SQLs.
Parallel hints
The PARALLEL hint can invoke parallel processing. In its simplest form, the hint takes no argument as in the following example:
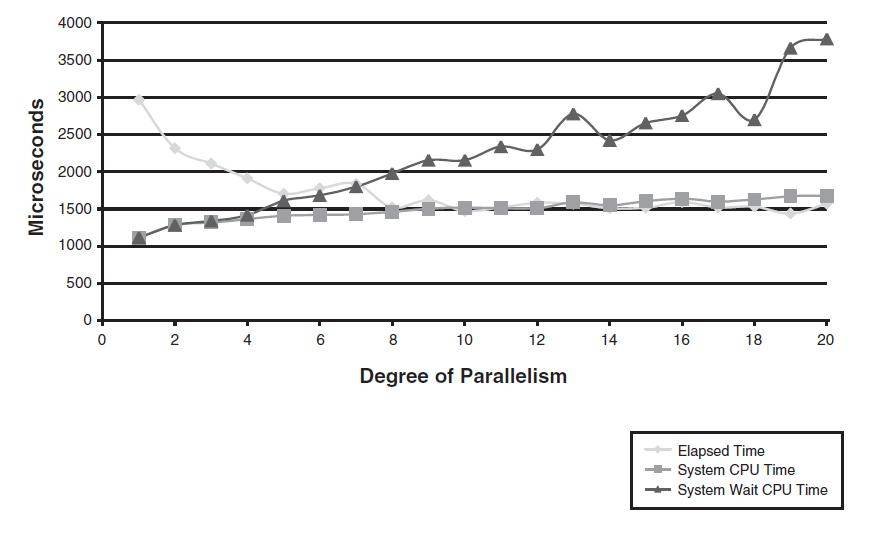
Figure 13-5 Increasing the DOP causes increases in system CPU wait times.
SELECT /*+ parallel */ * FROM sh.sales s
It's legal, but not always necessary to specify a table name or alias in the hint:
SELECT /*+ parallel(s) */ * FROM sh.sales s
The hint can request a specific DOP:
SELECT /*+ parallel(s,8) */ * FROM sh.sales s;
The NOPARALLEL hint can be used to suppress parallel processing:
SELECT /*+ noparallel */ COUNT ( * ) FROM sales;
In 11g release 2, the AUTO option allows you to request that the AUTO setting for PARALLEL_DEGREE_POLICY be used to calculate the DOP:
SELECT /*+ parallel(auto) */ COUNT ( * ) FROM sales;
For ad-hoc query execution, you might want to set an explicit DOP. However, for SQL embedded within an application, this might not be a good idea because the SQL will be less able to adapt to changes in machine configuration (more CPUs for instance), workload (more concurrent sessions), or configuration (changes to the number of parallel slaves or the default DOP). For embedded SQL, it's probably better to omit an explicit DOP or to use the AUTO keyword (in Oracle 11g Release 2 and higher).
Parallel configuration parameters
Determining the optimal DOP, especially when taking concurrent system activity into account, is a daunting task. Luckily, Oracle has invested significant effort into automating the process. Each release of Oracle has increased the level of intelligent automation of parallel configuration. In general, you should try Oracle's automation before attempting to manually configure automatic processing.
Nevertheless, significant tweaking is possible; the following lists the significant configuration parameters that you can adjust to optimize parallel SQL:
| parallel_adaptive_multi_user | When set to TRUE, Oracle will adjust the DOP to account for the load on the system. On a heavily loaded system, Oracle will reduce the DOP from the requested or default degree. |
| parallel_degree_limit | In Oracle11g Release 2 and higher, places an absolute limit on the DOP that can be achieved. A value of CPU prevents the DOP from exceeding that specified by parallel_threads_per_cpu. A value of IO sets the maximum to the IO limit determined by running DBMS_ RESOURCE_MANAGER.CALIBRATE_IO. AUTO allows Oracle to select a value. An integer value corresponding to a specific DOP might also be specified. |
| parallel_degree_policy | In 11G release 2 and forward, this parameter controls the means by which the DOP will be calculated. MANUAL equates to the behavior in 11.1 and earlier. If AUTO, the DOP will be calculated based on the types of operations in the SQL statement and the sizes of the tables. AUTO also enables parallel queries to fetch data from the buffer cache rather than using direct path IO and will queue parallel processes if the requested DOP execution is not immediately available. |
| parallel_execution_message_size | Sets the size of buffers for communication between the processes involved in parallel processing. |
| parallel_force_local | From Oracle 11g Release 2 forward, this parameter, if set to TRUE, suppresses multi-instance parallelism on RAC clusters. |
| parallel_io_cap_enabled | This 11g parameter if set to TRUE will limit the DOP to that which Oracle thinks the IO subsystem can support. To use the parameter, you should first use DBMS_RESOURCE_MANAGER.CALIBRATE_IO to determine these IO limits. |
| parallel_max_servers | The maximum number of parallel servers that can be started. This provides an absolute limit on the amount of concurrent parallel operations that can execute. |
| parallel_min_percent | If set to nonzero, this parameter determines the minimum acceptable DOP for a query. If the DOP requested or determined cannot be provided due to system load or other parallel processes that are using the parallel server pool, the DOP will be reduced only to the value of PARALLEL_MIN_ PERCENT. For instance, if your query requested a DOP of 8 and only 5 were available (5 / 8 = 62%), your query would execute in parallel if PARALLEL_ MIN_PERCENT was below 62. If PARALLEL_MIN_ PERCENT were above 62, your statement will either terminate with an error or, if PARALLEL_DEGREE_ POLICY is set to AUTO, will be queued for later execution. |
| parallel_min_servers | The minimum number of parallel servers—the number that will be initialized when the database is first started. |
| parallel_min_time_threshold | Specifies the amount of elapsed time (in seconds) required for a SQL statement to be automatically parallelized. If the estimated elapsed time of a SQL statement exceeds the threshold, Oracle automatically parallelizes the SQL. The default of AUTO results in Oracle automatically calculating a value. |
| parallel_threads_per_cpu | Sets the number of parallel threads that can be applied per CPU. Oracle generally restricts the DOP so that this limit is not exceeded. |
MONITORING PARALLEL SQL
Because multiple processes are involved in parallel execution, explaining, tracing, and monitoring parallel execution can be more complex than for serial SQL.
Parallel explain plans
EXPLAIN PLAN reflects additional steps for a parallelized SQL statement that reflect the additional parallel operations involved in the parallel execution.
For instance, consider this simple SQL statement and explain plan:
SQL> EXPLAIN PLAN FOR
2 SELECT * FROM customers
3 ORDER BY cust_last_name;
|
|
|
|
| 0 | SELECT STATEMENT | |
| 1 | SORT ORDER BY | |
| 2 | TABLE ACCESS FULL | CUSTOMERS |
The CUSTOMERS table is scanned, and the rows scanned are sorted. When the statement is parallelized, additional operations are added to the execution plan:
SQL> EXPLAIN PLAN FOR
2 SELECT /*+ parallel */ *
3 FROM customers
4 ORDER BY cust_last_name;
SQL> SELECT * FROM table (DBMS_XPLAN.display
2                (null,null,'BASIC +PARALLEL'));
|
|
|
|
|
|
|
| 0 | SELECT STATEMENT | ||||
| 1 | PX COORDINATOR | ||||
| 2 | PX SEND QC (ORDER) | :TQ10001 | Q1,01 | P->S | QC (ORDER) |
| 3 | SORT ORDER BY | Q1,01 | PCWP | ||
| 4 | PX RECEIVE | Q1,01 | PCWP | ||
| 5 | PX SEND RANGE | :TQ10000 | Q1,00 | P->P | RANGE |
| 6 | PX BLOCK ITERATOR | Q1,00 | PCWC | ||
| 7 | TABLE ACCESS FULL | CUSTOMERS | Q1,00 | PCWP |
The new plan contains a variety of PX steps that describe the parallel operations involved. Let's look at each of these steps:
| PX BLOCK ITERATOR | This operation is typically the first step in a parallel pipeline. The BLOCK ITERATOR breaks up the table into chunks that are processed by each of the parallel servers involved. |
| PX SEND | PX SEND operations simply indicate that data is being sent from one parallel process to another. |
| PX RECEIVE | PX RECEIVE operations indicate the data being received by one parallel process from another. |
| PX SEND QC | This is a send operation to the parallel query co-coordinator process. |
| PX COORDINATOR | This step simply indicates that the parallel query co-coordinator is receiving the data from the parallel streams and returning it to the SQL statement. |
Figure 13-6 illustrates how these steps relate to parallel processing with a DOP of 2.
PX SEND and PX RECEIVE operations are associated with distribution options— shown in the "PQ Distrib" column of DBMS_XPLAN—which describe how data is sent from one slave to another. In sort operations it's typical to see
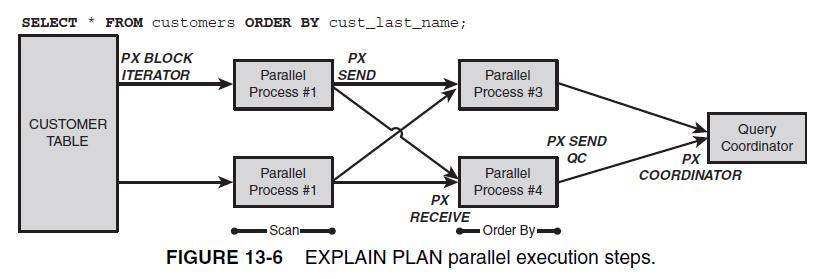
Figure 13-6 EXPLAIN PLAN parallel execution steps.
the RANGE option because rows to be sorted are distributed based on the value of the sort columns. For instance when sorting by CUST_FIRST_NAME as in the preceding query, Oracle might send names from A–K to one slave and names from L–Z to the other. Here are the commonly encountered distribution options:
| RANGE | Rows are distributed based on ranges of values. This is typical when sort operations are parallelized. |
| HASH | Rows are distributed to parallel query slaves based on a hash of the value concerned. This is suitable for joins and HASH GROUP BY operations and generally ensures a more even distribution of rows than for RANGE operations. |
| RANDOM | Rows are randomly assigned to parallel query slaves. |
| ROUND ROBIN | Rows are distributed one at a time in a circular fashion, just as you would deal cards in a game of poker. |
The IN-OUT column of the DBMS_XPLAN output describes how data flows between and within the parallel processes. The column corresponds to the OTHER_TAG column in the PLAN_TABLE table. These columns can contain one of the values shown in Table 13-1.
The presence of a PARALLEL_FROM_SERIAL or S->P tag in the PLAN_TABLE or DBMS_XPLAN output might represent a serial bottleneck in an otherwise parallel execution stream.
Tracing Parallel execution
Using SQL trace to tune our queries becomes somewhat more difficult when the SQL is parallelized. This is because each process involved in the parallel execution has its own trace file. Furthermore, because these processes are shared among all parallelized SQLs and sessions, the trace files contain trace data for other SQLs and sessions in addition to the ones we are interested in.
Table 13-1 Parallel Data Flow Tags
|
|
|
|
| P->P | PARALLEL_TO_PARALLEL | This tag denotes parallel processing that passes results to a second set of parallel processes. For instance, a parallel table scan might have passed results to a parallel sort. |
| P->S | PARALLEL_TO_SERIAL | This is usually the top level of a parallel query. The results are fed in parallel to the query coordinator. |
| P->S PCWC |
PARALLEL_COMBINED_ PCWC WITH_PARENT PARALLEL_COMBINED_ WITH_CHILD |
The step was executed in parallel. Either the parent step or the child step was also executed in parallel by the same process. For instance, in a parallel nested loops join, the parallel query process scanned the driving table and also issued index lookups on the joined table. |
| S->P | PARALLEL_FROM_SERIAL | A serial operation that passed results to a set of parallel processes. The presence of this tag can indicate a serial bottleneck within a parallel statement because it suggests that parallel processing might wait on serial processing. |
However, it is possible, through a somewhat convoluted process, to trace parallel execution. Here are the steps:
- Set a unique client identifier in your session using DBMS_SESSION.SET_ IDENTIFIER.
- Enable tracing for that client identifier using DBMS_MONITOR.CLIENT_ ID_TRACE_ENABLE.
- Run your parallel SQL.
- Use the trcsess utility to create a new trace file that contains only trace entries for your client identifier.
- Analyze the new trace file as usual.
Here we invoke steps 1, 2, and 3:
BEGIN
  DBMS_SESSION.set_identifier ('gh pqo test 27');
  DBMS_MONITOR.client_id_trace_enable
   (client_id => 'gh pqo test 27',
    waits => TRUE);
END;
/
SELECT /*+ parallel */ prod_name, SUM (amount_sold)
  FROM products JOIN sales
  USING (prod_id)
GROUP BY prod_name
ORDER BY 2 DESC;
Here we perform steps 4 and 5:
$ trcsess clientid='gh pqo test 27' output=pqo_test_27.trc *
$ tkprof pqo_test_27.trc pqo_test_27.prf sort='(prsela,fchela,exeela)'
TKPROF: Release 11.1.0.6.0 - Production on Mon Dec 29 19:40:38 2008
Copyright 1982, 2007, Oracle. All rights reserved.
The merged trace file now accurately reflects not only the activity from our invoking session, but also from all the parallel server processes that were involved in executing the query.
To trace a parallel execution, set a Client Identifier and use the trcsess utility to extract trace records for that client identifier into a single file.
Advanced tracing of parallel server activity can also be achieved by using the "_px_trace" facility. For instance
ALTER SESSION SET "_px_trace"="compilation","execution","messaging";
The 10391 event can also be used to dump information about parallel server allocation:
ALTER SESSION SET EVENTS '10391 trace name context forever, level 128';
Both of these events generate rather cryptic and sometimes voluminous output and should probably be used only if all other techniques fail to shed light on parallel execution.
The V$PQ_TQSTAT View
Even with EXPLAIN PLAN and SQL trace output, it's hard to work out exactly how a parallel query executed. For instance, what was the actual DOP? How much work did each parallel server process do?
The V$PQ_TQSTAT view contains information about the data transferred between each set of parallel query servers, including the number of rows transmitted and received. Unfortunately, the view is visible only from within the session that issued the parallel query and only for the most recent query executed. This limits its usefulness in a production environment, but it is still invaluable when tuning parallel queries.
For instance, consider this parallel query:
SQL> SELECT /*+ parallel */
2   prod_id, SUM (amount_sold)
3  FROM sales
4 GROUP BY prod_id
5 ORDER BY 2 DESC;
|
|
|
|
|
|
|
| 0 | SELECT STATEMENT | ||||
| 1 | PX COORDINATOR | ||||
| 2 | PX SEND QC (ORDER) | :TQ10002 | Q1,02 | P->S | |
| 3 | SORT ORDER BY | Q1,02 | PCWP | ||
| 4 | PX RECEIVE | Q1,02 | PCWP | ||
| 5 | PX SEND RANGE | :TQ10001 | Q1,01 | P->P | |
| 6 | HASH GROUP BY | Q1,01 | PCWP | ||
| 7 | PX RECEIVE | Q1,01 | PCWP | ||
| 8 | PX SEND HASH | :TQ10000 | Q1,00 | P->P | |
| 9 | HASH GROUP BY | Q1,00 | PCWP | ||
| 10 | PX BLOCK ITERATOR | Q1,00 | PCWC | ||
| 11 | TABLE ACCESS FULL | SALES | Q1,00 | PCWC |
If we query V$PQ_TQSTAT directly after the query executes we can see the number of rows passed between each of the parallel server sets. Each of the unique TQ_IDs corresponds to one of the interactions between server sets denoted in the execution plan by 'P->P' or 'P->S' values for the IN-OUT column. You can correlate the value of TQ_ID with the TQ column in the EXPLAIN PLAN output.
SQL> SELECT dfo_number, tq_id, server_Type, MIN (num_rows),
  MAX (num_rows),count(*) dop
2   FROM v$pq_tqstat
3 GROUP BY dfo_number, tq_id, server_Type
4 ORDER BY dfo_number, tq_id, server_type DESC;
For complex parallel SQLs, there might be multiple parallel pipelines that are indicated by different values for the DFO_NUMBER column.
Use the V$PQ_TQSTAT view to measure the actual DOP and amount of data transferred between parallel servers.
Other statistics
We can get a view of parallel execution occurring on the system in real time by examining the V$PX_SESSION view, which shows which parallel slave processes are currently executing SQL. Joining V$PX_SESSION to V$SESSION and V$SQL enables us to identify the sessions and SQLs currently employing parallel processing to see the desired and actual DOP:
SQL> WITH px_session AS (SELECT qcsid, qcserial#, MAX (degree) degree,
2    MAX (req_degree) req_degree,
3    COUNT ( * ) no_of_processes
4   FROM v$px_session p
5  GROUP BY qcsid, qcserial#)
6 SELECT s.sid, s.username, degree, req_degree, no_of_processes,
7  sql_text
8 FROM v$session s JOIN px_session p
9   ON (s.sid = p.qcsid AND s.serial# = p.qcserial#)
10  JOIN v$sql sql
11   ON (sql.sql_id = s.sql_id
12   AND sql.child_number = s.sql_child_number)
13  /
SID USERNAME DEGREE REQ_DEGREE NO_OF_PROCESSES
---------- -------- ---------- ---------- ---------------
SQL_TEXT
---------------------------------------------------------
144 OPSG 18 18 36
select /*+ parallel(sa,18) */ prod_id,sum(quantity_sold)
, sum(amount_sold) from sales_archive sa group by prod
_id order by 3 desc
V$SYSSTAT contains some statistics relating to parallel query downgrades that can help us determine how often parallel queries are being downgraded from the requested DOP:
SQL> SELECT name,value, round(value*100/sum(value) over(),2) pct
2 FROM v$sysstat
3 WHERE name LIKE 'Parallel operations%downgraded%';
|
|
|
|
| Parallel operations not downgraded | 109 | 93.97 |
| Parallel operations downgraded to serial | 0 | 0 |
| Parallel operations downgraded 75 to 99 pct | 0 | 0 |
| Parallel operations downgraded 50 to 75 pct | 3 | 2.59 |
| Parallel operations downgraded 25 to 50 pct | 2 | 1.72 |
| Parallel operations downgraded 1 to 25 pct | 2 | 1.72 |
![]()
![]() Parallel SQL
Parallel SQL
![]() Using parallel SQL to improve Oracle database performance
Using parallel SQL to improve Oracle database performance
![]() Parallel processing: Using parallel SQL effectively
Parallel processing: Using parallel SQL effectively
![]() Parallel execution: Determining SQL suitability, benefits
Parallel execution: Determining SQL suitability, benefits
Printed with permission from Prentice Hall Inc. Oracle Performance Survival Guide: A Systematic Approach to Database Optimization by Guy Harrison. For more information about this title and other similar books, please visit http://www.prenticehall.com.